
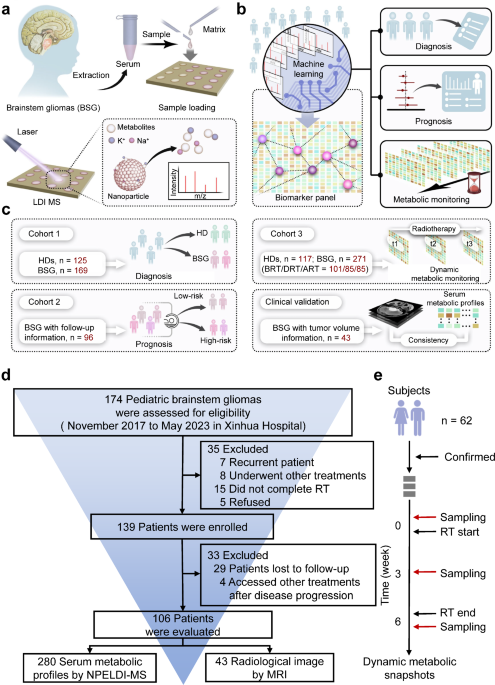
Study design and patient cohort characteristics
We first applied an analytic framework with a case-control design on the cross-sectional cohort (cohort 1) to diagnose BSG from the aspects of static metabolic snapshots. We successively prognosed the radiotherapy sensitivity among BSG patients (cohort 2) via univariant and multivariant Cox regression and validated the performance by log-rank test, including 96 BSG patients with a follow-up period of more than 1 year as prognostic outcomes. Lastly, we sought progressive metabolic evolution correlated with radiotherapy responses by clustering of metabolic trajectories with dynamic metabolic snapshots on the longitudinal cohort (cohort 3). Demographic and clinical characteristics of the enrolled participants are presented in Supplementary Tables 1 and 2.
We established a Chinese BSG cohort within a duration of 6 years (from November 2017 to May 2023) at Xinhua Hospital Affiliated to Shanghai Jiao Tong University School of Medicine. The cohort comprised 174 BSG patients and 125 HDs, from which we enrolled 106 BSG patients satisfying the following criteria. These criteria included (1) BSG diagnosed by magnetic resonance imaging (MRI) presentation and clinical symptoms, (2) completion of radiotherapy, and (3) a follow-up period of more than a year (Fig. 1d). Given the complexities and inherent risks associated with performing biopsies in brainstem tumors, particularly in cases of diffuse intrinsic pontine glioma, obtaining WHO grades for all patients present challenges, especially before 202034. To ensure the accuracy of patient enrollment and diagnosis as BSG cases, the diagnosis of each patient was collaboratively reviewed by 2 oncologists and imaging specialists. If conflicting opinions arose, senior physicians were consulted to avoid any potential biases in data evaluation. To capture the dynamic metabolic snapshots at high resolution, we performed a design of high-density blood sampling on the longitudinal cohort consisting of 62 BSG patients. Consenting participants submitted three-weekly blood draws prior to radiotherapy, until the completion of one cycle of radiotherapy (three serum samples collected for each participant, Fig. 1e).
To evaluate BSG-related metabolic snapshots, we employed a pretreatment-free MS approach that incorporated ferric nanoparticles to substitute the commonly used liquid/gas phase extraction and separation. The NPELDI-MS allowed sample multiplexing with reproducible metabolic profiles for native serum inputs as trace as 0.1 μL (Supplementary Fig. 1a, coefficient of variation 1b). As a result, detection process of 405 serum samples in this project was completed within ~3 h.
The raw MS spectrum recorded ~120,000 data points with a total ion count of ~7 × 10⁷ within the mass range of 100–1000 Da. After quality control and data filtering (see details in Supporting Information), we obtained 402 metabolic features (defined as the localized highest intensity of the raw MS data) across different samples (Supplementary Fig. 1c). Among these, 287 features (71.4%) varied from HDs to BSG patients (p t-test). Notably, the serum metabolic snapshot database, which contains a sufficient amount of signal intensity and feature number, serves as the foundation for the downstream analysis.
Diagnostic value of circulating metabolites in BSG patients
Given that metabolic reprogramming is crucial for cancer occurrence35,36,37, we were thus interested in delineating the distinct metabolic patterns between HDs and BSG based on the static metabolic snapshots (Supplementary Fig. 2a). We built diagnostic classification models based on machine learning algorithms on the discovery set (n = 45/54, HDs/BSG). The computational pipeline for machine learning of serum metabolic profiles from the sets included feature selection and model building (Fig. 2a, Supplementary Fig. 2b). Specifically, there were no significant differences in age and gender (p > 0.05) between BSG and HDs in the discovery set (Supplementary Table 3). The classification performance was further evaluated on an independent validation set (n = 15/19, HDs/BSG). Notably, we obtained 81.2% power at 0.05 significance level with a sample size of 80 (40/40, HDs/BSG), based on the preliminary study on 12 individuals (6/6, HDs/BSG, Supplementary Fig. 2c). The result indicated the discovery and validation sets hold adequate sample size for validating the classification models.

a Study design for BSG diagnosis using machine learning. Static metabolic snapshots from 99 participants (45/54, HDs/BSG) in the discovery set for feature selection and model building. The optimized model was tested in an independent validation set (15/19, HDs/BSG). b Coefficients of the least absolute shrinkage and selection operator (LASSO) and Ridge algorithms were shown as the evaluation index for seven metabolic features. c t-distributed stochastic neighbor embedding of serum metabolic profiles for 60 HDs and 73 BSG patients was plotted using identified metabolites. d Receiver operating characteristic (ROC) curves of the discovery set and validation set to distinguish HDs and BSG patients within the metabolic panel. The corresponding confusion matrices were shown as the inset. e ROC curves analysis was shown with each single feature (AUC of 0.662–0.818) of seven-feature diagnostic panel. f Violin-plot illustrated the differential regulation of normalized intensities for metabolic features in HDs and BSG. Statistical significance was calculated using two-sided Student’s t-test. ***p p p = 5.224 × 10⁻⁸ (LA); 0.004 (LA’); 4.446 × 10⁻⁵ (Val); 4.944 × 10⁻⁸ (Leu); 4.422 × 10⁻⁵ (Thr); 0.0008 (2AAS); 0.025 (Orn). g Potential pathways were differentially regulated in HDs and BSG patients. Color and size of each circle were correlated to the p value and enrichment ratio. Statistical significance was calculated using enrichment analysis by MetaboAnalyst 5.0 ( LA and LA’ lactic acid, Val valine, Leu leucine, Thr threonine, 2AAS 2-aminomuconic acid semialdehyde, Orn ornithine. Source data are provided as a Source Data file.
In the feature selection step, we sought to utilize dimension-reduction strategies to classify BSG versus HDs based on the outstanding features with more cost-effective combinations of the molecules (Supplementary Fig. 3a, b, Supplementary Table 4). Considering the p (number of predictors) » n (number of samples) problems, two widely used shrinkage methods, least absolute shrinkage and selection operator (LASSO) and Ridge, were employed to select the optimal biomarker combination based on the highest coefficient weights in two algorithms (Fig. 2b). As a result, seven metabolic features corresponding to six metabolites were identified as highly ranked biomarkers (mean intensity > 200, p value 0.18), including 2-aminomuconic acid semialdehyde, lactic acid, valine, leucine, threonine, and ornithine (Supplementary Table 5)38,39. Unsupervised clustering analysis partly intuitively distinguished BSG from HDs, including t-distributed stochastic neighbor embedding (Fig. 2c) and principal component analysis (Supplementary Fig. 2d).
We further conducted in-vitro studies to investigate the biological effects of metabolite biomarkers on SHSMU-DIPG-01 cells. Our findings revealed concentration-dependent effects of these metabolites on DIPG cell proliferation, as validated by the cell counting kit-8 assay (p 4). These results suggest that these metabolites play a regulatory role in DIPG cell behavior, potentially by modulating metabolic pathways or inducing metabolic stress. This aligns with the broader impact of metabolic reprogramming on tumor development and progression37. The sensitive responses of DIPG cells to these metabolites further support their potential as biomarkers for distinguishing BSG from healthy individuals.
In the model-building step, four commonly used algorithms, including LASSO, Ridge, K-nearest neighbor (kNN), and random forest (RF), were used to construct classification models on the metabolite biomarker combinations. The optimized model by RF reached the highest area under the curve (AUC) of 0.923 (95% confidence interval (CI) = 0.870–0.976) based on the receiver operating characteristic curve (ROC) analysis in the discovery set. We then tested the model on the validation set, resulting in a promising AUC of 0.933 (95% CI = 0.853–1.000) for distinguishing BSG patients from HDs (Fig. 2d, Supplementary Fig. 5a, b, Supplementary Table 4). We recruited a new cohort (Supplementary Table 2) from Shanghai Xinhua Hospital, with 161 samples collected (96/65, BSG/HDs) as the external set. Notably, the external set was independent from the discovery and validation sets in model construction stage and blinding to the as-built model (Supplementary Fig. 6a). The situations for blood drawn were the same for all sample sets. We obtained the AUC of 0.847–0.852 (Supplementary Fig. 6b), consistent with the previous results in the methodology development. The consistent diagnostic results validated the robustness of the biomarkers, facilitating translation of the biomarkers to larger patient populations.
An evaluation of the reliability of the machine-learning strategy was conducted using confusion matrices, which demonstrated that samples were classified with a high accuracy of 86.9% in discovery set and 88.2% in validation set (Fig. 2d). Importantly, the panel constructed of seven metabolic features together outperformed the diagnostic performance by single one of these features (AUC: 0.662–0.818, Fig. 2e, Supplementary Table 5). Another major challenge in clinical practice is the differentiation of BSG from other neural diseases by MRI imaging40. We added the comparison between BSG and other neural diseases (28 encephalitis cases and 40 idiopathic epilepsy cases) through the static metabolic snapshots. We adopted the same protocol to detect the differences (Supplementary Fig. 7a). As a result, the models also achieved outstanding performance in differentiating BSG from encephalitis and idiopathic epilepsy, with AUC of 0.929 and 0.923, respectively (Supplementary Fig. 7b).
Specifically, five features were over-regulated (p value p value 2f). Furthermore, metabolite set enrichment analysis showed several BSG-disturbed metabolic pathways based on Small Molecule Pathway Database (SMPDB) dataset, such as valine, leucine, and isoleucine degradation, glycine and serine metabolism, threonine and 2-oxobutanoate degradation, propanoate metabolism, as compared to HDs (Fig. 2g, Supplementary Table 6). Subsequently, we conducted metabolite set enrichment analysis using Kyoto Encyclopedia of Genes and Genomes (KEGG) dataset to identify the most strongly influenced metabolic pathways using the identified metabolites. Our findings revealed that the metabolites were notably enriched in six distinct metabolic pathways, aligning with the results obtained from the SMPDB dataset (Supplementary Fig. 8).
To further investigate the biological mechanisms underlying the differences between BSG and HDs, we performed differential expression analysis using RNAseq data obtained from orthotopically xenografted BSG specimens (brainstem tissues, n = 4) and age-matched controls (normal brainstem tissues, n = 3, Supplementary Fig. 9). We also validated the correlation based on the analysis of the GEO dataset GSE162976, comparing DIPG cells against two distinct neural progenitor controls: human neural stem cells (hNSC) and normal human astrocytes (NHA; Supplementary Fig. 10). As a result, we detected notable variances in gene expression within the perturbed metabolic pathways, which were reflected in the RNAseq expression data obtained in this study and further supported by the consistent results obtained from GEO database.
Moreover, our exploration revealed the regulation of specific genes associated with the adaptive reprogramming of tumor cells. Notably, the genes Arg1, Arg2, Nos2, and P4ha1 were found to reprogram arginine and proline metabolism. Meanwhile, Arg1, Arg2, and Nos2 were shown to disturb arginine biosynthesis. Arginine was converted into ornithine through the action of arginase. Additionally, the genes Hpgds and Nat8f6 were identified as key regulators in glutathione metabolism. Gldc and Pgam2 were also found to influence the metabolism of glycine, serine, and threonine. Furthermore, Enpp1 and Enpp3, which encode two critical enzymatic components of the pantothenate and CoA biosynthesis pathway, were shown to be epigenetically regulated in brain tumors. These modulations closely related to the Warburg effect and the TCA cycle, and regulate the expression of lactate. Lastly, Aox4 was found to regulate tyrosine metabolism as well as the degradation of valine, leucine, and isoleucine, in conjunction with Hmgcs2. Therefore, we speculated that the unique metabolic signature arises from the metabolic rewiring of brain tumors, potentially offering valuable insights for BSG.
Taken together, these findings suggest a unique metabolic signature existed in BSG and demonstrated the power of metabolic profiling for biomarker discovery. The panel constructed by circulating metabolites facilitates rapid detection of BSG more precise and accessible.
Static metabolic snapshots correlated with the prediction of BSG
We proceeded to investigate the potency of using static metabolic snapshots in cohort 2 to predict prognosis of BSG. To determine the clinical outcome of this study, we enrolled patients who had been followed up for over one year and collected survival data as well as clinical information (including gender and age). A total of 96 patients were included in the prognosis study with OS being 4 months to 51 months and a median OS being 11 months. Importantly, clinic follow-ups of these BSG patients were carried out via phone calls or health records to ensure the completeness of data (Fig. 3a). Similar to the diagnostic section, we analyzed the static metabolic snapshots from two randomly assigned sample sets, containing 58 observations with 41 deaths for training set and 38 observations with 31 deaths for a testing set (Fig. 3b).

a Clinical information of 96 BSG patients. Created in BioRender. Yang, Y.(2025) b Workflow for building the prognostic model via seven-feature panel by calculating risk scores based on static metabolic snapshots. c Plots of overall survival (OS) duration and risk score of each patient. The vertical dash line demonstrated the median score of −2.7 and stratifies patients into high-risk group (red) and low-risk group (blue) in training set (green) and testing set (blue). d Kaplan–Meier curves of OS of patients in the low-risk group (blue line) and high-risk group (red line) with p = 0.031 by log-rank test in the training set and p = 0.044 by log-rank test in the independent testing set. Source data are provided as a Source Data file.
We conducted a variable selection on the training set and built the composite risk score on the testing set (Fig. 3b). In particular, the univariate Cox regression was applied to reduce dimensionality and select metabolic features associated with the OS of BSG. Then, the multivariant Cox regression model was constructed to predict prognosis associated with metabolic vulnerabilities. Importantly, we identified a seven-feature panel correlated with clinical outcomes, consisting of lactic acid, oxalacetic acid, niacinamide, threonic acid, succinic acid, arginine, and glucose (Supplementary Table 7). Importantly, even after adjusting for key clinical covariates such as age, gender, BMI, and Lansky score, as suggested by previous studies41, the odds ratios of risk scores remained nearly unchanged (Supplementary Table 8).
Our in vitro experiments demonstrated the specific effects of metabolic markers on cell viability in SHSMU-DIPG-01 models (Supplementary Fig. 11). In particular, we have already validated lactic acid in the diagnostic panel. Hence, its presence in the prognostic panel does not warrant further investigation. Besides, arginine, succinic acid, and lactic acid exhibited significant anti-proliferative effects on DIPG cells (p p
The prognostic panel consisted of differentially regulated metabolites together identified 14 potentially altered metabolic pathways (Supplementary Fig. 12a). We thus conducted RNAseq experiments on subcutaneous xenografted BSG specimens after radiotherapy (tumor tissues, n = 5) and age-matched BSG specimens before radiotherapy (tumor tissues, n = 6). We highlighted seven differentially expressed genes (DEGs) (ALDOC, CA9, FBP1, HKDC1, LOC102724560, NDUFA4L2, and P4HA2), associated with the metabolic pathways identified in the prognostic panel and expression data (Supplementary Fig. 12b). In particular, glycolysis/gluconeogenesis appeared enriched in tumor cells. Tumor growth is characterized by the upregulation of ALDOC, FBP1, and HKDC1 correlated with increased glucose and fructose consumption and lactate production42. Similarly, amino acid metabolism, regulated by P4HA2 and LOC102724560, a significant hallmark of glioblastoma impacting patient prognosis, has been confirmed through our metabolic and sequencing results and supported by existing literature43,44.
To mechanistically characterize the pathophysiological divergence between before RT (BRT) and after RT (ART) among BSG, we identified six significantly enriched pathways correlated with the prognostic metabolic signature in BSG through gene set enrichment analysis (Supplementary Fig. 12c). Enriched pathways involve TNF signaling, NF-κB signaling, p53 signaling, HIF-1 signaling, hippo signaling, and MAPK signaling, which have been demonstrated to impact on the sensitivity of tumors to radiotherapy45,46. Intensive studies indicate that the prognostic panel of metabolites could be involved in the regulation of these signaling pathways, which have the potential to influence radiation prognosis. Specifically, lactate enhances the stability of HIF-1α, which promotes its transcriptional activity and subsequently regulates tumor growth and sensitivity to RT47. Glucose stress induces O-GlcNAcylation and further activates hippo-YAP pathways to promote tumorigenesis48. Niacinamide activates p53 activation and suppresses PARP1 to mediate DNA repair and cell proliferation in tumor49. Succinic acid promotes not only cancer cell migration and invasion but also cancer metastasis, mediated by PI3K-HIF-1α axis50. Arginine activates NF-κB signaling by regulating mTORC1-mediated lysosomal release of essential amino acids. It also induces the generation of intracellular nitric oxide, which stimulates HIF-1α signaling and further promotes tumor proliferation51. Threonine metabolism influences tumor cell proliferation by driving abnormal tRNA modifications and protein translation within tumors52. Thus, we conclude that the prognostic panel reflects the rewired metabolism of tumors.
The risk score for every patient in both the training set and the testing set was estimated based on the formula, by summing up the product of each feature intensity and coefficient weight. Based on the dichotomized label on the median risk score, the BSG patients were stratified into two groups: the high-risk group and the low-risk group. Notably, the high-risk group (risk score > −2.7) contained 29 observations with 24 events in the training set and 14 observations with 14 events in the testing set. Meanwhile, there were 29 observations with 17 events in the training set and 24 observations with 16 events in the testing set among the low-risk group (risk score 3c). Multivariate Cox regression analysis demonstrated that the risk score tightly correlated with mortality risk and became an important factor of survival in both the training and testing sets.
We compared the OS duration of BSG patients. Kaplan-Meier curves were applied to evaluate the prognostic prediction efficiency of the risk score. Accordingly, the median OS duration in the low-risk group was significantly more prolonged than the OS duration in the high-risk group (p = 0.031 in the training set and p = 0.044 in the testing set, by log-rank test, Fig. 3d). In this study, we also collected the information of molecular subtypes and MRI imaging, and further explored the prognostic effectiveness of H3K27M mutation (p = 0.004, log-rank test, Supplementary Fig. 13a), TP53 mutation (p = 0.554, log-rank test, Supplementary Fig. 13b), and ring enhancement (p = 0.106, log-rank test, Supplementary Fig. 13c). These results suggested higher levels of risk score acquired from static metabolic snapshots are correlated with significant or borderline significant worse patient outcomes. Notably, we validated the prognosis efficiency of static metabolic snapshots in predicting prognostic risks of BSG patients.
Dynamic metabolic snapshots during radiotherapy
Circulating metabolites undergo dynamic changes during radiotherapy and are closely associated with the therapeutic efficacy of this treatment modality53,54. We examined the dynamic metabolic snapshots with a time series to evaluate the connection with the radiotherapy prognosis. Specifically, the metabolic profiles of 43 BSG patients were investigated at a total of three time points before, during, and after radiotherapy (BRT/DRT/ART, Fig. 4a). Corresponding MRI images were also collected for all enrolled patients to facilitate comprehensive analysis and interpretation of the data.

a Sample information collected for 43 BSG participants. Created in BioRender. Yang, Y.(2025) b Calculation of the change in tumor size based on magnetic resonance imaging (MRI) images. c ROC curves to distinguish volume-decreasing participants from volume-increasing participants using the static metabolic snapshots collected BRT. d Clustering of metabolic trajectories using dynamic metabolic snapshots along HDs, BRT, DRT, and ART. e Probabilities of six biomarkers tracing with potential clustering tendency. f Scatter plots of six metabolites constructed the diagnostic panel among HDs (black), BRT (red), DRT (blue), and ART (green). Orange lines referred to the average intensity of the metabolites in each group. Statistical significance was calculated using pairwise comparison via multiple two-sided t test. g Dynamic alterations of lactic acid in low-risk (blue) and high-risk (red) groups. Statistical significance was calculated using two-sided Student’s t-test. *p p = 3.686 × 10⁻⁷. n.s. p > 0.05. Source data are provided as a Source Data file.
Clinically, difference in tumor volume size measured by MRI is an evaluation criterion of radiotherapy55,56. Based on the tendency of tumor change shown from MRI images (Fig. 4b), we achieved a good predictive capability in distinguishing volume-decreasing participants from volume-increasing participants based on the BRT metabolic profiles, with an AUC of 0.818 by 5-fold cross validation (95% CI: 0.690–0.946, Fig. 4c). The results demonstrated consistency between metabolic profiles and actual tumor volume changes.
Our samples were mainly from the HDs and BSG (as cohort 3) in the different periods of radiotherapy, including 117 HDs, 101 BRT, 85 DRT, and 85 ART, revealed detailed temporal patterns of metabolic changes. Interestingly, we found that metabolites with uni-directional behaviors dominated the features, and over half of them were significantly different between HDs and disease groups, as well as made a change in the development of radiotherapy (Supplementary Fig. 14a). These findings highlighted that even though the amount of each compound dynamically changes between HDs and BSG during radiotherapy, a highly coordinated metabolite regulatory network underlies the therapy process.
We further performed c-means clustering using the differential metabolites among four phases (HDs, BRT, DRT, and ART) and identified eight distinct clusters (Fig. 4d and Supplementary Fig. 14b). Notably, 23.1% of all metabolites in cluster 1 and cluster 2 showed a marked alteration in BSG patients from HDs and a stepwise increase or decrease during radiotherapy. Metabolites in cluster 3 showed an increase and achieved the top in DRT, then a large decrease afterward, whereas metabolites in cluster 4 had a marked increase in disease groups and a large decrease with radiotherapy, suggesting that unique metabolic vulnerabilities may appear in disease groups which could be exploited to monitoring the therapeutic effects of radiotherapy.
According to the diagnostic biomarker panel, we collected the probabilities of these biomarkers tracing in the potential cluster tendency (Fig. 4e). In particular, the 2-aminomuconic acid semialdehyde approached cluster 1 and gradually increased deviated the normal levels. Valine and threonine from cluster 2 were opposite of the tendency in cluster 1. Lactic acid and ornithine were included in cluster 3 and largely influenced by the radiotherapy process. Leucine from cluster 4 had no difference during the radiotherapy process (Fig. 4f). Importantly, we found lactic acid involved in pyruvate metabolism had different tendencies along with radiotherapy progression in low-risk and high-risk groups within the longitudinal cohorts of 62 BSG participants (Fig. 4g).
We further performed preclinical animal study using mouse tumor models to acquire paired samples (i.e., mice brain tumor and mice serum before and after radiation) with the same analysis from discovery set. The preclinical animal study also indicated significant alterations in metabolite levels before and after radiotherapy treatment in BSG, aligning with observations in paired serum samples (Supplementary Fig. 15).
Taken together, these findings depicted a programmed metabolic trajectory over the course of radiotherapy, providing a systematic value for treatment response and prognostic implications.


