
Optical properties of MoOCl2 and PEEM method
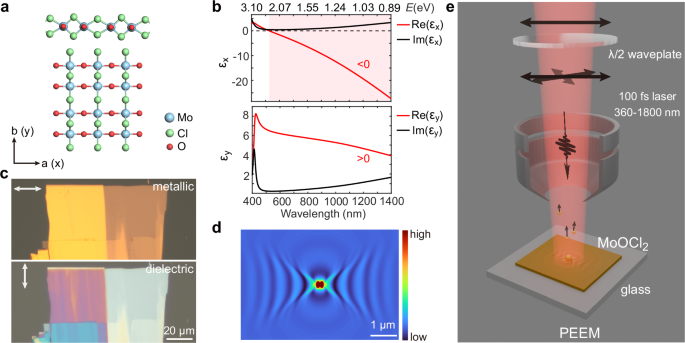
The crystal structure of each layer of the MoOCl2 flake is shown in Fig. 1a, highlighting strong in-plane anisotropy (space group C2/m). The structure is strongly coupled along the Mo-O chains, while the interchain coupling in the orthogonal direction is significantly weaker. The measured permittivity is shown in Fig. 1b, with metallic (εx εy > 0) characters in the visible to near-infrared range along the two orthogonal directions, respectively (see Supplementary Note 3 for details of the permittivity measurements and Note 2 for comparison with other polariton materials). This anisotropy is also evident in the optical images of a representative sample taken with a reflective optical microscope (Fig. 1c), which show golden metallic luster and dielectric film color with polarizations along the x- and y-axes, respectively.

a Crystal structure of each layer of the MoOCl2 flake. The experimental coordinate axes (x, y) are along the crystal orientations (a, b), respectively. b Measured permittivity along the two orthogonal directions in the visible to near-infrared range. The light red shading indicates Re(εx)c Optical images of a representative sample taken with a reflective optical microscope at x- and y-polarizations, showing golden metallic luster and dielectric film color, respectively. d Simulated hyperbolic plasmon polariton mode (electric field |E |) supported by a 40 nm MoOCl2 flake on a glass substrate at 1000 nm wavelength, excited by an Au nanoparticle with x-polarization at normal incidence. e Schematic of PEEM measurements for near-field modes supported by MoOCl2 flakes, allowing polarization and wavelength control at normal incidence.
The hyperbolic plasmon polariton is determined by the measured permittivity, as confirmed in the representative finite-difference time-domain simulation. This simulation involves a tens of nm thick MoOCl2 flake on glass, excited by an Au nanoparticle under normal light incidence (Fig. 1d).
To observe the broadband hyperbolic modes, we employed ultrahigh-spatial-resolution PEEM, integrated with a tunable femtosecond laser beamline (360–1800 nm). Unless otherwise specified, the light was incident at normal angles, with polarization controlled by a λ/2 waveplate. The schematic of the PEEM setup is illustrated in Fig. 1e. Near-field imaging in the near-infrared with PEEM relies on a multi-photon photoemission process to overcome the material’s work function. In this study, a sub-monolayer of cesium (Cs) was deposited on all sample surfaces, lowering the work function to enable a two-photon photoemission process. The nonlinear photoemission yield follows \({P}_{E}\propto {I}^{2}\), where PE is the photoemission intensity and I is the local light intensity (Supplementary Fig. 3, see also Supplementary Note 13 for more discussions on the PEEM method). Additionally, all PEEM measurements were conducted at ~ 85 K.
Wavelength-dependent mode distributions
A representative MoOCl2 sample for PEEM studies is shown in Fig. 2e, with a thickness of ~ 37 nm. The MoOCl2 flakes were mechanically exfoliated and transferred onto a glass substrate, coated with a thin (~ 10 nm) ITO layer to avoid surface charging during the PEEM experiments. SiO2-coated Au nanoparticles (5 nm SiO2 @ 200 nm Au) placed on top of the MoOCl2 flakes served as couplers to excite hyperbolic plasmon polariton modes in MoOCl2 (see Methods section and Supplementary Note 1 for details on sample fabrication and characterizations).

a Hyperbolic plasmon polariton modes from 1.03 eV (1200 nm) to 1.38 eV (900 nm) supported by a ~ 37 nm MoOCl2 flake, excited from SiO2-coated Au nanoparticles (5 nm SiO2 @ 200 nm Au). b Corresponding iso-frequency contours (IFCs) (fast Fourier transform (FFT) of (a)), fitted with hyperbolas (white dashed lines). c Mode distributions at shorter wavelengths, from 1.77 eV (700 nm) to 2.25 eV (550 nm), showing the transition from hyperbolic mode to elliptical air mode. d Corresponding FFT images of (c). The white dashed cycles in (d) signify k0. The color scales in (a, b) are also applied to (c, d). e Optical dark-field image of the measured sample, the yellow circle denotes the measured area by PEEM. f Variation of measured open angles (2θ) of hyperbolas in (b) with wavelengths (red dots), and the corresponding calculated curve from the measured permittivity.
The measured representative near-field modes in the near-infrared to visible range are shown in Fig. 2a, c, with x-polarization at normal incidence. In Fig. 2a, within the energy range from 1.03 eV (1200 nm) to 1.38 eV (900 nm), hyperbolic modes were clearly observed, with up to six distinct interference fringes visible (the bright points correspond to Au nanoparticles). The corresponding IFCs in Fig. 2b, obtained via fast Fourier transform (FFT) of Fig. 2a are well fitted by hyperbolic equations: \(\frac{{k}_{x}^{2}}{{\varepsilon }_{{y\_fit}}}+\frac{{k}_{y}^{2}}{{\varepsilon }_{{x\_fit}}}={\omega }^{2}/{c}^{2}\). The open angle decreases with increasing wavelength in k space, in agreement with calculations from the measured permittivity \(\theta=\frac{\pi }{2}-\arctan \sqrt{-{\varepsilon }_{x}/{\varepsilon }_{y}}\) (Fig. 2f) (see Supplementary Note 5 for FFT data processing details). It should be noted that the observed maximum k is ~ 4k0 (Fig. 2b), significantly larger than the conventional Au SPPs (~ k0)27.
At shorter wavelengths with x-polarization, the hyperbolic mode becomes not observable anymore, whereas the elliptical air mode still emerges (Fig. 2c, d), with the transition occurring at ~ 1.77 eV (700 nm) (It should be noted that we can still observe 1 − 2 fringes of hyperbolic modes at 700 nm, but the visibility is very weak compared to that around 1000 nm). We attribute this transition to several possible reasons. First, as the wavelength decreases, the absorption of MoOCl2 increases, leading to an increased loss for hyperbolic modes. Second, the real part of εx increases as wavelength decreases, indicating a weakening of the material’s metallic properties and, consequently, diminishing the hyperbolic properties. Third, the excitation efficiency of the air mode is correlated with the size of the Au nanoparticle and increases with decreasing wavelength. At even shorter wavelengths (2 has better plasmonic properties at longer wavelengths (e.g., > 800 nm) in the near-infrared than at shorter wavelengths (e.g., 35,41, and they have similar color under optical microscope. The enhanced absorption at shorter wavelengths originates from the d-band excitation in Au42, whereas the case in MoOCl2 is more complex, involving the total contribution of eight bands near the Fermi level, mainly from the 4 d orbitals of Mo atoms17.
The experimental results described above are well reproduced by simulations and theoretical calculations using the measured permittivity (See Supplementary Figs. 5–7 and further discussions on mode analysis in the Supplementary Note 7, including hyperbolic and air modes, as well as the lenticular mode, the latter of which can be significantly excited at short wavelengths with y-polarization). In addition, wavelength-dependent PEEM studies on a straight sample edge (along the y-axis) with x-polarization, along with the extracted dispersion relations, are presented in the Supplementary. Note 7 (Supplementary Fig. 8). The effect of MoOCl2 flake thickness on the excited hyperbolic modes (Supplementary Fig. 10) and the inefficient excitation with Au nanoparticles underneath MoOCl2 (Supplementary Fig. 16) were also explored.
Polarization control and reconstruction of IFCs
To further characterize and manipulate the anisotropic behavior of hyperbolic plasmon polaritons, polarization control was performed for both single MoOCl2 flakes and twisted bilayers (tBLs). For a single flake, as shown in Fig. 3a, the hyperbolic polaritons can be tailored by laser polarization. In real space (Fig. 3d), the propagation direction of hyperbolic modes changes with the rotation of light polarization, that is, the two branches of the hyperbola are excited asymmetrically. Such an asymmetry is more clearly observed in the k space (Fig. 3g), indicating polarization-selective excitation in the IFCs.

a–c Optical images of MoOCl2 samples with single flake and twisted bilayers. Thickness, twist angle, and PEEM measured area (red circle) are indicated. The arrows in (a–c) indicate the a-axis of MoOCl2 flakes, and the flake with the orange arrow is below the flake with the purple arrow. d–i Corresponding PEEM and FFT images with the four polarizations at a representative wavelength of 1000 nm (φ = 0° corresponds to x-polarization).
In the case of MoOCl2 tBLs, the hyperbolic modes of the upper and lower layers hybridize, giving rise to new hybridized IFCs. The twist angle between the two layers offers a degree of control over polaritons, as already demonstrated in α-MoO343,44,45. Similar to the behavior in a single flake, laser polarization serves as an effective tool for controlling polaritons due to polarization-selective excitation in the hybridized IFCs. Fig. 3b, c showcase two representative samples with twist angles of approximately 52° and 90°, highlighting polarization control in a twisted system (see Supplementary Figs. 11 and 12 for the hyperbolic modes in each layer forming the tBLs). At a 52° twist, x-polarization results in directional propagation (Fig. 3e) and nearly flat IFCs (Fig. 3h), with this directionality further enhanced at 45°-polarization due to the flatter IFCs, and reduced at 135°-polarization. At a 90° twist, an elliptical mode emerges in real space (Fig. 3f), signifying a topological transition induced by the twist angle, with the elliptical mode rotating alongside the polarization. More importantly, at the 90° twist, the polarization selectivity in k space reveals rotating, square-like IFCs (Fig. 3i), suggesting the potential for using polarization excitations to reconstruct the full IFCs in k space.
As illustrated in Fig. 4, the full IFCs are reconstructed by combining the IFCs from the four representative polarization excitations shown in Fig. 3g–i. The range of observable IFCs is significantly expanded for tBLs, particularly at the 90° twist. It’s important to note that at least two orthogonal polarizations are necessary to reconstruct the full IFCs. While using additional polarizations can improve the signal-to-noise ratio (see Supplementary Figs. 13 and 14 and Supplementary Movie. 1), the four representative polarizations in Fig. 3 are sufficient to achieve an acceptable signal quality. The polarization control in PEEM is effective and flexible, rather than by rotating the sample46,47, which unprecedentedly revealed the full IFCs in the near-infrared and provided guidance for the manipulation of polaritons in applications.

a–c Reconstructed IFCs by the superposition of the IFCs excited from the four representative polarizations in Fig. 3g–i. The principle of polarization-selective excitation in the IFCs is presented in (b), with the red dashed regions indicating the excitation range under specific polarizations. The white and yellow dashed lines correspond to the IFCs of the lower and upper layers of MoOCl2, respectively.
Manipulating polaritons with artificial structures
The PEEM measurements discussed above are based on single-point excitation. However, for technological applications, fabricating artificial structures to control hyperbolic polaritons is a more practical approach48,49. In this study, we demonstrated the ability to manipulate polaritons using etched ring slits on MoOCl2 (Fig. 5a, b). These ring slits act as point-array excitations, following Huygens’ principle50, as illustrated in Fig. 5c. The slits with predefined ring diameters (d) and slit widths (w) were fabricated using a focused ion beam (FIB). Representative PEEM images of a ring slit (d = 10 μm; w = 25 nm) at different wavelengths and x-polarization are presented in Fig. 5b. Both the variation in internal propagation patterns and external nanofocusing with changing wavelength can be observed, which aligns with the schematics provided in real and k spaces in Fig. 5c, d.

a Optical image of a representative MoOCl2 flake (~ 60 nm) with etched ring slits. b PEEM images at different wavelengths with x-polarization at normal incidence, for the ring slit marked in (a). The yellow dashed lines indicate the focusing of hyperbolic polaritons outside the ring slit. c, d Schematics of internal propagation and external nanofocusing induced by the curvature of ring slit in real and k spaces, respectively. In (c), the colors indicate the electric field intensity (low in blue and high in red). e, f Polarization control for another ring slit on a ~ 50 nm MoOCl2 flake in real and k spaces, respectively.
Hyperbolic polaritons offer the potential for superior nanofocusing compared to conventional SPPs, as they support much higher k-values, allowing them to surpass the diffraction limit. Polarization control of the hyperbolic mode was also demonstrated using ring slits to manipulate polariton propagation and focusing (Fig. 5e, f), highlighting their potential use in practical devices. In addition, the excitation efficiencies of hyperbolic polaritons with varying slit widths are explored in Supplementary Fig. 15. PEEM can further be utilized to characterize and detect more complex structures and devices on MoOCl2, aiding in the optimization of their performance.
In summary, we have experimentally revealed the broadband near-infrared hyperbolic plasmon polaritons supported by MoOCl2 flakes with the ultrahigh-spatial-resolution PEEM. The polaritons were dynamically tailored and controlled through tunable light polarization, wavelength at normal incidence and interlayer twist, observed in both real and k spaces. Particularly, the full iso-frequency contours were reconstructed by incorporating polarization-selective excitations. In addition, we demonstrated the feasibility to manipulate polaritons using designed artificial structures on MoOCl2. This study also highlights PEEM as a highly effective method for nanoimaging polaritons in vdW materials, offering significant potential for nanoscale light manipulation. We believe that this work will stimulate broad interest in hyperbolic physics and its applications, including hyperbolic topological photonics, hyperbolic LSPRs, and hyperbolic polarization and sensing devices.


